01 Jun
Traffic Report: Intermodal, May 2023
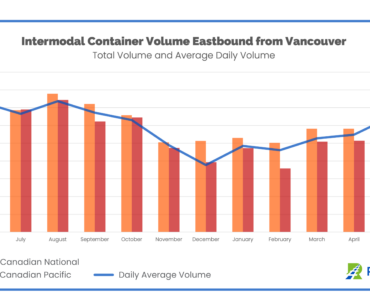
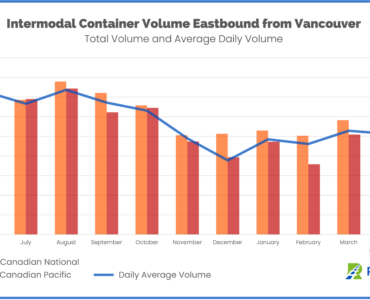
In May, more than 67,000 intermodal containers originated in Vancouver, resulting in a daily average volume of 2,163 containers per day. This represents a 18.4% increase in the daily average volume compared to April.
23 May
Disruption Report: Alberta Wildfires, May 2023
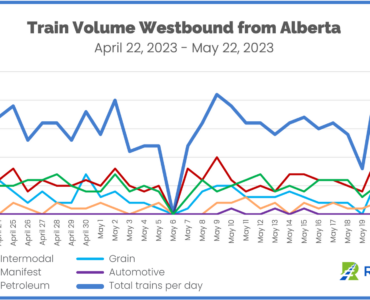
Widespread wildfires in Alberta have impacted freight volume through the region. On May 6, no trains moved westbound from Alberta. May 19-22 saw another period of significant variability.
18 May
Traffic Report: Cross Border, April 2023
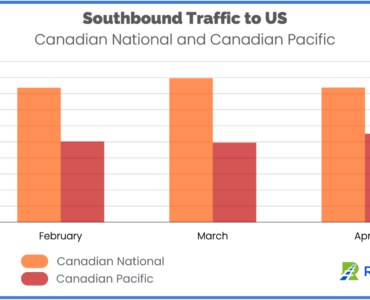
Total southbound traffic from Canada was 134,124 cars in February, 139,283 in March, and 138,996 in April. CN commands the majority of that traffic, 62.4% of total southbound traffic over the past three months. This is higher than the proportion
18 May
Traffic Report: Western Ports, April 2023
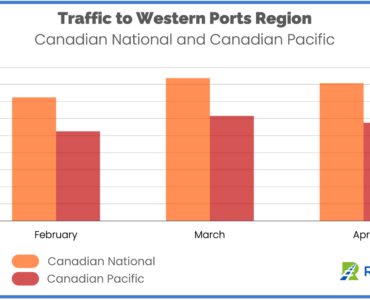
Import traffic into the ports of Vancouver and Ridley eclipsed traffic moving westbound into the ports region in April, with 143,173 carloads coming into Canada compared to 138,194 moving toward the ports, a 4,974 car difference.
18 May

Traffic Report: Intermodal, Mid-May 2023
For the period May 1-15, 30,109 intermodal containers originated in Vancouver, resulting in a daily average volume of 2,007 containers per day. This represents a 10% increase in the daily average volume from April.
02 May

Intermodal Traffic Report: Small Rebound in Interm...
More than 53,000 intermodal containers originated in Vancouver in April, resulting in a daily average volume of 1,775 per day, a 0.93% increase over March.
18 Apr
Intermodal Traffic Report: Import Traffic Through ...
For April 1-15, 25,607 intermodal containers originated in Vancouver. The daily average volume of 1,707 containers per day is 3% lower than in March.
10 Apr

FreightWaves – People Speaking Rail: How Shi...
RailState Co-Founder and CCO John Schmitter joined "People Speaking Rail" on FreightWaves TV to speak about the value of data for rail operations and how Teck Resources Limited used RailState to find a way around a rail line washout.
29 Mar
Rail Capacity Report – 3/21/2023 – 3/2...
We’ve been reporting on commodity movement in Canada to the Port of Vancouver for the last six months.
24 Mar

The Ultimate Guide to Railroad Classes: Defining C...
This guide will tell you all the basics about Class I, Class II, and Class III railroads including what the railroad classes are and what railroads qualify as Class I railways.


